Tag: PassMark

  • Entry-Level Intel Wildcat Lake CPU Matches MacBook Neo A18 Pro in Benchmarks

    Entry-Level Intel Wildcat Lake CPU Matches MacBook Neo A18 Pro in Benchmarks

    Key Takeaway

    – Intel’s Wildcat Lake series targets affordable, lightweight laptops as MacBook Neo rivals.
    – Entry-level Core 3 304 (5-core, 1 performance core) nearly ties Apple’s A18 Pro in benchmarks.
    – Single-thread scores: Core 3 304 at 3,676 vs. A18 Pro at 3,982 (only ~7.7% difference).
    – CPU Mark scores are similar: 11,543 for Intel vs. 11,804 for Apple’s A18 Pro.
    – Early results based on just 3 samples; scores may shift with more testing.


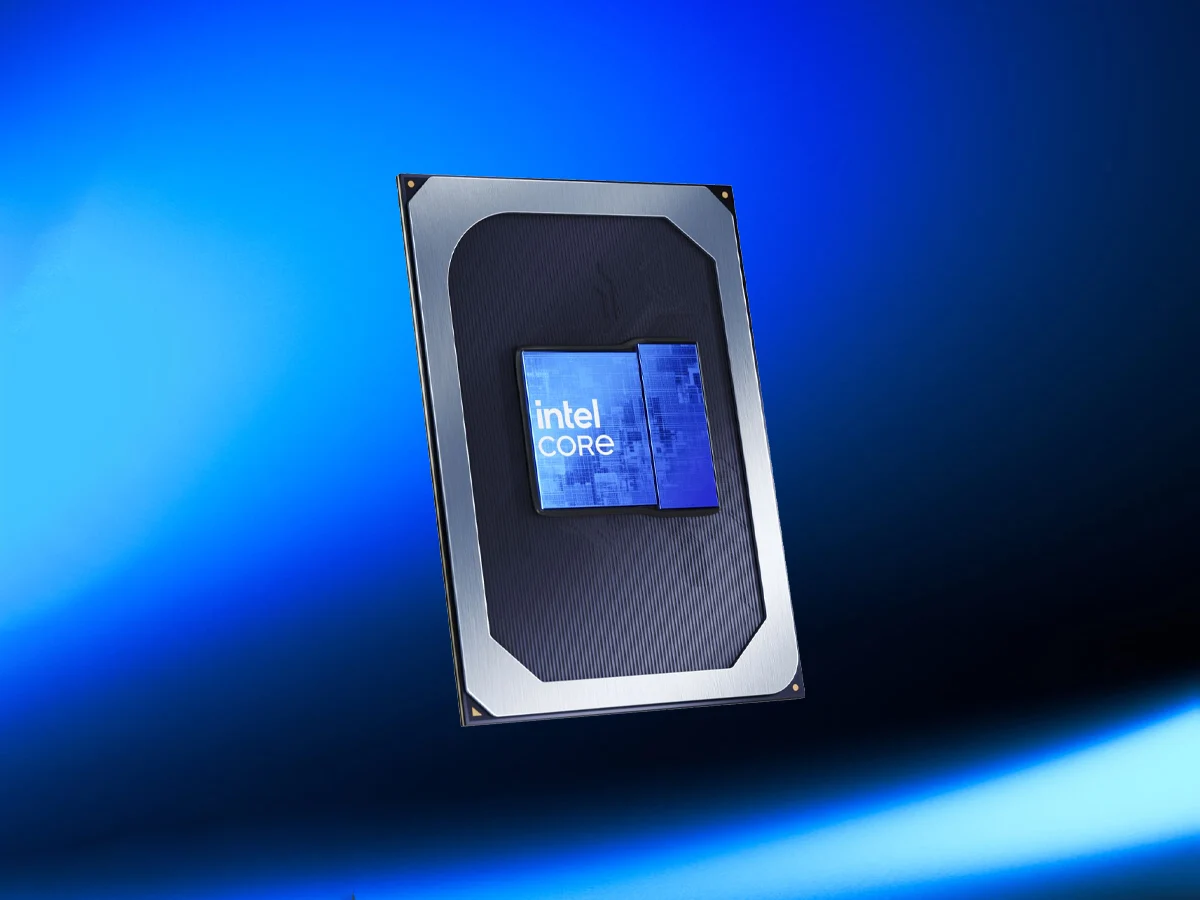
    Intel’s New Wildcat Lake Chips Show Up in Benchmarks

    Intel has launched the Wildcat Lake series for lightweight and affordable laptops, and some companies have already released MacBook Neo rivals powered by these processors. While in-depth reviews haven’t appeared yet, recently discovered benchmark results give a early look at what these CPUs can do, and the numbers are pretty surprising for a budget chip.

    Entry-Level CPU Ties With Apple A18 Pro

    A notable benchmark result from Passmark shows the Intel Core 3 304, the entry-level chip in the new lineup, holdig its own against Apple’s best. It uses a five-core configuration, with only one performance core, but even so it seems to have tied against the Apple A18 Pro found in the MacBook Neo, which is a mobile processor. The Apple A18 Pro got a single-thread rating of 3,982 on the benchmark, while the Intel Core 3 304 got 3,676 points, a difference of around 7.7% which is impressive for an entry-level Intel part.

    Multi-Core Performance Is Very Close

    In terms of multi-core performance, which shows the overall score from eight differnet tests, the two processors are very similar. Specifically, the Intel Core 3 304 scores 11,543 points on the CPU Mark test, while the MacBook Neo’s A18 Pro scores 11,804 points. These results are quite impressive, since the Intel chip is a budget design, and its worth noting that the score for the Intel CPU is based on only three samples so far. With more samples tested, the final score could shift, but at this early stage it is quite impressive to see the entry-level Wildcat Lake achieving such benchmark performance.

    First Laptops With Core 3 304 Already Announced

    For anyone interested, the HP OmniBook 3, IdeaPad Slim 3i, and Chuwi UniBook are among the first laptops that are confirmed to feature the Core 3 304 processor, with more options from different brands expected to arrive soon. These laptops are designed to compete in the budget space, offering light weight and affordable pricing, making them potential rivals to the MacBook Neo for users who want Windows compatability.

    Sources
  • Intel Arc G3 Extreme Launches with 14 Cores and Arc B390 Graphics

    Intel Arc G3 Extreme Launches with 14 Cores and Arc B390 Graphics

    Key Takeaway

    1. MSI’s upcoming gaming handheld, the Claw 8 EX AI+, is expected to feature the Arc G3 Extreme processor, with a listed price of €1,599.
    2. The Arc G3 Extreme includes a 14-core CPU, 12 MB L3 cache, and is designed as a higher-tier option compared to the standard Arc G3 and other handheld APUs.
    3. Performance claims regarding the Arc G3 Extreme should be approached cautiously, as benchmark data is preliminary and not definitive.
    4. MSI plans to unveil the Claw 8 EX AI+ at Computex 2026 in June.

    Initial Rumors about MSI’s New Gaming Handheld

    Early today, a retail store in Italy founds listed MSI’s next handheld gaming device for about €1,599, featuring a Arc G3 Extreme processor. This new model, known as the Claw 8 EX AI+, is likely to appear alongside the Claw A8 (which costs around $1,299 currently), rather than replacing older models too quickly. It seems MSI plans to introduce this at the upcoming tech exhibition, Computex 2026.

    Details About the Chipset and Benchmark Leaks

    Strangely, the same chipset has been seen on Passmark’s database before its official announcement. Intel might announce an Arc G3 version as an affordable alternative to their G3 Extreme, similar to how AMD launched the Ryzen Z2 and Z2 Extreme back in 2025. The specifications listed on the screenshot imply it’s meant for the Claw 8 EX AI+ handheld, rather than some different device. Also, the Arc G3 Extreme’s core architecture includes the Arc B390, a powerful 12-core iGPU combining Xe3 cores, but Intel currently restricts this to their Core Ultra X 300 series processor.

    Hardware Specifications and Performance Expectations

    The listing additionally specify that the Arc G3 Extreme features a 14-core CPU with 18 MB L2 cache and 12 MB L3 cache. It also has 2 Performance cores combined with 12 Efficient cores, but interestingly, it does not support Hyper-threading. Still, it’s too early to pass final judgment based solely on one benchmark test. Claims that the Arc G3 Extreme will outperform the Ryzen Z2 Extreme and other handheld APUs by a large margin are premature. MSI probably plans to launch the Claw 8 EX AI+ officially at the Computex 2026 event, in June.


    Sources

  • Intel Core Ultra X9 388H Beats AMD Ryzen AI 9 HX 370 in Passmark

    Intel Core Ultra X9 388H Beats AMD Ryzen AI 9 HX 370 in Passmark

    Key Takeaways

    1. The Intel Core Ultra X9 388H processor features 16 cores, including high-performance and efficiency cores, and is equipped with the Arc B390 iGPU.
    2. Performance results show only slight improvements over the previous generation, with a 10% increase in multithread performance and similar single-thread results.
    3. The 388H scored just below 38,000 points in multithread testing and approximately 4,450 points in single-thread performance on Passmark.
    4. The Panther Lake processor has a slight edge over AMD’s Ryzen AI 9 HX 470, which scored around 36,500 points in multithread tests.
    5. The Arc B390 iGPU is highlighted for its strong performance, reportedly outperforming the Radeon 890M by nearly 100% in gaming scenarios, making it suitable for compact laptops and mini PCs.


    The Intel Core Ultra X9 388H “Panther Lake” processor has been revealed and is now available on Passmark. The performance results show only slight improvements compared to the previous generation chips, even though Intel has been touting a significant boost of 60% in multithreaded tasks.

    Specifications Overview

    The Intel Core Ultra X9 388H features a configuration of 16 cores, which includes four high-performance Cougar Cove cores, eight Darkmont efficiency cores, and an additional 4 low-power Darkmont cores. For graphics, it utilizes the Arc B390 iGPU equipped with 12 Xe3 cores. According to the Passmark data noted by @x86deadandback on X, the 388H achieves a score of just below 38,000 points in multithreaded testing and approximately 4,450 points in single-thread performance.

    Performance Comparison

    When compared to the Core Ultra 9 285H, the Panther Lake processor shows about a 10% enhancement in multithread performance, while the single-thread results are nearly the same. Currently, only a couple of samples of the 388H have been tested on Passmark, which means that the scores are likely to fluctuate as more data comes in. Notably, the 285H has a 300 MHz higher boost clock than the 388H and a better P-core ratio, which makes the results look quite encouraging.

    AMD’s Position

    Fans of AMD might feel let down since the AMD Ryzen AI 9 HX 470 only managed to attain around 36,500 and 4,200 points in single-thread and multithread tests, respectively. This gives the Panther Lake chip a slight edge. While benchmarks alone aren’t definitive, it suggests that AMD could face challenges against Intel in 2026.

    Interestingly, as highlighted by TechPowerUp, the standout feature of the Panther Lake processor is likely the Arc B390 iGPU. Leaked benchmark information indicates that the B390 outperforms the Radeon 890M by nearly 100% in practical gaming scenarios. For compact laptops that can’t fit discrete GPUs and mini PCs, the Panther Lake chips appear to be a very attractive option.

    Exciting Offers

    Eager for Panther Lake mini PCs? The GMKtec Evo-T1, which comes with 64 GB of memory and 2 TB of storage, is currently priced at $300 less on Amazon.

    Passmark, x86deadandback, noted by TechPowerUp.

    Source:
    Link


  • AMD Ryzen AI Max+ 388: New Strix Halo Chip with Radeon 8060s GPU

    AMD Ryzen AI Max+ 388: New Strix Halo Chip with Radeon 8060s GPU

    Key Takeaways

    1. The AMD Ryzen AI Max+ 388 features an 8-core/16-thread CPU and a Radeon 8060s integrated GPU.
    2. It scored 4,145 in single-core performance and 31,702 in multi-core performance on PassMark benchmarks.
    3. The multi-core score is lower than that of the Ryzen AI Max 385, but single-core performance is comparable to other Strix Halo CPUs.
    4. The ‘388’ designation indicates a potential mid-cycle update, with more models like the Ryzen AI Max 392 possibly in the works.
    5. AMD aims to refresh the Strix Halo line to compete with Nvidia’s upcoming N1X series, expected around 2026.


    A new AMD Strix Halo CPU has appeared in the PassMark database, as noted by Moore’s Law is Dead on YouTube. This processor, known as the Ryzen AI Max+ 388, features an interesting combination of CPU and GPU. It includes an 8-core/16-thread CPU alongside a Radeon 8060s integrated GPU, which was once only available in the higher-end Ryzen AI Max+ 395.

    Performance Scores

    In PassMark’s benchmarks, it achieved a score of 4,145 for single-core performance and 31,702 for multi-core. The single-core result aligns well with other Strix Halo CPUs, while the multi-core score is a bit lower than the Ryzen AI Max 385. Unfortunately, details about key specifications like base and boost clock speeds, as well as GPU clock rates, have not been disclosed.

    Future Prospects

    The designation ‘388’ for the Ryzen AI Max+ 388 suggests it may be part of a mid-cycle update expected to launch next year, with additional models likely on the way. Moore’s Law is Dead mentioned a Ryzen AI Max 392, but we couldn’t locate any information about that model.

    It seems reasonable that AMD would refresh the Strix Halo line, especially since its next version, Medusa Halo, isn’t anticipated until 2027. This update will enable AMD to compete with Nvidia’s upcoming N1X series, which is projected to be introduced around 2026.

    PassMark’s database shows how AMD is trying to keep up with the fast-paced tech industry.

    Source:
    Link


  • Intel Core Ultra 245HX Laptop CPU Beats Desktop in Benchmarks

    Intel Core Ultra 245HX Laptop CPU Beats Desktop in Benchmarks

    Key Takeaways

    1. The Intel Core Ultra 5 245HX laptop CPU shows impressive performance scores with 4,500 in single-core and 40,000 in multi-core tests, outperforming its predecessor by 25% and 37%, respectively.

    2. Unlike previous generations, the 55-watt Core Ultra 5 245HX laptop CPU is faster than the desktop variant, the 65-watt Core Ultra 5 245.

    3. The Core Ultra 5 245 has lower performance scores at 4,409 in single-core and 37,930 in multi-core compared to the 245HX, showing a shortfall of 2.7% and 5.3%.

    4. The 245HX has a maximum turbo power of 160 watts, surpassing the 121 watts of the Core Ultra 5 245, despite its lower base power.

    5. This scenario is unusual as it is rare for a laptop CPU to outperform a comparable desktop CPU, highlighting the advancements in laptop processing technology.


    The Intel Core Ultra 5 245HX laptop CPU has recently appeared on Passmark, showcasing its notable performance capabilities. What’s even more surprising is that this laptop CPU seems to surpass its desktop version, the Core Ultra 5 245 “Arrow Lake” CPU.

    Performance Scores Unveiled

    According to a report from TechPowerUp, the Core Ultra 245HX CPU has a single-core score of about 4,500 and a multi-core score reaching 40,000. This marks a significant improvement over its predecessor, the Intel Core i5-14500HX, showing enhancements of 25% in single-core performance and 37% in multi-core performance. However, the comparison with its desktop variant adds an intriguing twist.

    Desktop vs. Laptop: A Surprising Comparison

    In the previous generation, the Core i5-14500 “Raptor Lake” desktop CPU was about 9.6% and 8.9% quicker in single-core and multi-core tests compared to its laptop version, the Core i5-14500HX, as per Passmark. This time, though, the 55-watt Core Ultra 5 245HX laptop CPU is significantly faster than the desktop’s 65-watt Core Ultra 5 245. Thankfully, the 125-watt Core Ultra 5 245K, which is priced at $259.99 on Amazon, still leads the pack.

    Detailed Score Breakdown

    To get into specifics, the Core Ultra 5 245 achieves a score of about 4,409 in single-core and 37,930 in multi-core performance, indicating a shortfall of 2.7% in single-core and 5.3% in multi-core compared to the Core Ultra 5 245HX laptop chip. Interestingly, while the base power of the 245HX is lower than that of the 245, its maximum turbo power is an impressive 160 watts, which greatly exceeds the Core Ultra 5 245’s 121 watts. This contrasts with the Raptor Lake generation, where both the 14500 and 14500HX had nearly identical turbo power ratings.

    As a single benchmark, this information isn’t the definitive measure of performance. Real-world usage can tell a different tale, but it’s still rare to see a laptop CPU outshine a comparable desktop version.

    Source:
    link


  • AMD Ryzen Threadripper 9980X: Fastest 64-Core Desktop CPU

    AMD Ryzen Threadripper 9980X: Fastest 64-Core Desktop CPU

    Key Takeaways

    1. AMD has launched the Ryzen Threadripper 9000 line, with the Threadripper 9980X being the latest model available since July 2025.
    2. The Threadripper 9980X achieved a benchmark score of 147,481, making it the fastest desktop processor among tested models.
    3. It features 64 cores, 128 threads, and clock speeds of 3.2 GHz (base) and 5.4 GHz (boost), along with a 256 MB L3 cache.
    4. The 9980X shows an 8.03% performance improvement over its predecessor, the Threadripper 7980X, which scored 136,517 on PassMark.
    5. AMD’s Threadripper series continues to dominate the high-end desktop processor market with limited competition.


    Unsurprisingly, AMD has once again made a splash with its nearly legendary Threadripper series. Not too long ago, Team Red officially unveiled the Ryzen Threadripper 9000 line, with the latest high-end desktop (HEDT) chips set to be available starting in July 2025. Now that July has arrived, an early model has shown up on the well-known PassMark benchmark. The AMD Ryzen Threadripper 9980X achieved a remarkable score of 147,481 in the multithread test, making it the fastest desktop processor among 1,450 tested.

    AMD’s Multithreaded Power

    AMD has always excelled in multithreaded testing with its Ryzen line, and the Threadripper 9980X harnesses its 64 cores and 128 threads to breeze through the CPU Mark test suite. Officially, it has clock speeds of 3.2 GHz (base) and 5.4 GHz (boost), along with a substantial 256 MB L3 cache to enhance system performance. The PassMark benchmark site notes a typical TDP of 350 W, highlighting that there is a considerable margin for error since this is the first iteration of this specific enthusiast-level Shimada Peak Threadripper to emerge thus far.

    Generational Upgrades

    When it comes to generational advancements, the Ryzen Threadripper 9980X is a successor to the Ryzen Threadripper 7980X (which can be found on Amazon), launched in 2023 and also featuring 64 cores. The previous CPU scored 136,517 on PassMark based on 74 samples, so the Zen 5-based model holds a respectable +8.03% advantage over its Zen 4-based forerunner. Given the lack of competition in this niche market, Team Red might think that huge improvements from one generation to the next aren’t really necessary in this case.

    Source:
    Link


  • GeForce RTX 5070 Benchmark vs RTX 4090: Surprising Results

    GeForce RTX 5070 Benchmark vs RTX 4090: Surprising Results

    Key Takeaways

    1. The Nvidia GeForce RTX 5070 samples showed lower performance than expected, with an average G3D Mark of 27,105, placing it just below the RTX 4090 Laptop GPU in benchmarks.

    2. Nvidia’s claim that the RTX 5070 would perform like the RTX 4090 for $549 is considered exaggerated, as the card struggles to match the performance of previous models like the RTX 4070 and RTX 4070 Ti.

    3. The introduction of Multi Frame Generation (MFG) allows the RTX 5070 to reach near RTX 4090 performance in some scenarios, but overall comparisons show it lagging behind in most tests.

    4. The desktop RTX 4090 outperforms the RTX 5070 by an average of 41.4%, raising questions about the ethical implications of Nvidia’s marketing claims.

    5. The upcoming AMD Radeon RX 9070 and RX 9070 XT may challenge Nvidia’s position in the GPU market, offering competitive performance and pricing.


    Three Nvidia GeForce RTX 5070 samples have shown up on the PassMark benchmark platform, and their performance is lower than what was anticipated. There have been reports that the benchmark faced problems with Blackwell cards due to the discontinuation of 32-bit framework support; however, a patch is now available. It remains uncertain if the RTX 5070 samples benefited from this update or if they are still unintentionally limited. The samples achieved an average G3D Mark of 27,105 during the testing, which included runs in DirectX 9-12 and a GPU Compute benchmark. This score places the GeForce RTX 5070 just beneath the GeForce RTX 4090 in the overall ranking, but it’s essential to note that this refers to the mobile version of the chip (RTX 4090 Laptop GPU) and not the stronger desktop variant.

    Nvidia’s Promises

    When Nvidia introduced the GeForce RTX 5070, they stated that the desktop graphics card would deliver RTX 4090 performance for only $549. Clearly, this was an exaggeration from Jensen Huang, as the RTX 5070 would need to match the RTX 4090 in a single synthetic or gaming benchmark to justify such a claim. Thanks to Multi Frame Generation (MFG) helping out and ignoring potential latency issues, the Blackwell card has shown it can reach RTX 4090 performance levels. In our detailed review of the RTX 5070, we found that with MFG x4, the newer card could achieve 87 FPS in Star Wars Outlaws (at 4K, with ultra settings and ray tracing). In comparison, the older Ada Lovelace card performed around 90 FPS in our tests with regular frame generation and ray reconstruction. Therefore, Nvidia’s statement holds some weight, albeit it’s quite flimsy.

    Performance Comparison

    The benchmark results for the GeForce RTX 5070 on PassMark highlight the card’s struggle to outperform earlier desktop models like the RTX 4070 and RTX 4070 Ti. However, during our tests, the Blackwell card generally performed slightly better than the GeForce RTX 4070 Ti. The desktop version of the RTX 4090 is significantly ahead, boasting an average performance advantage of +41.4% over the RTX 5070. While GPU enthusiasts might have sensed that Team Green’s assertion was highly subjective, one can question the ethical nature of claiming that the RTX 5070 provides RTX 4090 performance concerning the average consumer’s understanding. Ultimately, it may not matter much for the RTX 5070, as the launch of the AMD Radeon RX 9070 and RX 9070 XT, with their attractive prices, solid performances, and fewer availability concerns, could give Team Red a head start in the GPU market.

    Source:
    Link


  • Juggernaut RTX 5090 System Dominates GPU Compute Benchmark

    Juggernaut RTX 5090 System Dominates GPU Compute Benchmark

    Key Takeaways

    1. The Nvidia GeForce RTX 5090 initially underperformed on PassMark, scoring lower than the RTX 4090 and at RTX 4080 levels in GPU Compute tests.

    2. PassMark updated its testing methodology to support 64-bit components, allowing the RTX 5090 and RTX 5080 to better showcase their performance capabilities.

    3. After the update, the RTX 5090’s average GPU Compute score improved significantly from 23,050 Ops/Sec to 30,178 Ops/Sec.

    4. High-end system configurations, such as those with an Intel Core Ultra 9 285K and 48 GB of RAM, can achieve impressive scores (e.g., 225,048 Ops/Sec) that highlight the RTX 5090’s potential.

    5. The advancements in testing and system setups emphasize the importance of having the right configuration to fully leverage the performance of high-end graphics cards like the RTX 5090.


    Over 100 samples of the Nvidia GeForce RTX 5090 graphics card have now been tested on PassMark’s platform, and the GPU Compute scores are looking significantly better. Earlier, the new Blackwell card faced challenges on the site, falling behind the RTX 4090 in overall performance, while it was nearly stuck at RTX 4080 levels for GPU Compute. The RTX 50-series cards seemed to be limited by their advanced tech, as PassMark had been using a 32-bit testing framework, but Nvidia had dropped support for OpenCL 32-bit in its latest graphics cards.

    Update on Testing Methodology

    Recently, PassMark implemented a patch for their site, allowing the GPU Compute test to use 64-bit components. This change means that graphics cards like the RTX 5090 and RTX 5080 can now show their actual performance capabilities. Although the official high-end video card rankings on the site haven’t been updated yet, the RTX 5090 page is already showcasing significant improvements in GPU Compute. Previously, the average score for the GeForce RTX 5090 in this benchmark was a rather disappointing 23,050 operations per second (Ops/Sec), compared to 28,240 Ops/Sec for the RTX 4090. It was surprising to see the RTX 5090 underperform on PassMark, especially given its strong results in our tests. Thankfully, the score for the Blackwell card has risen to a much more respectable 30,178 Ops/Sec.

    Impressive System Configurations

    Moreover, the recent visits by a few RTX 5090-based systems to the site have revealed some serious powerhouses. For example, even before the patch was available, one test run involving a PC with an Intel Core Ultra 9 285K and 48 GB of RAM on an Asus ROG Maximus Z890 Apex motherboard achieved an incredible score of 225,048 Ops/Sec in GPU Compute. This score is almost 10 times higher than the previous average score for the RTX 5090 and roughly 7.5 times faster than the latest average result. While the average score is crucial for understanding the overall performance of a graphics card like the GeForce RTX 5090, this remarkable score demonstrates that with the right setup, gamers and PC builders can really maximize the benefits of their $2,000+ investment.

    Source:
    Link


  • GeForce RTX 5090D Outperforms RTX 4090 in Benchmark Tests

    GeForce RTX 5090D Outperforms RTX 4090 in Benchmark Tests

    Key Takeaways

    1. The Nvidia GeForce RTX 5090D achieved an impressive average score of 45,948 on PassMark, outperforming both the RTX 5090 and RTX 4090 in benchmarks.
    2. The RTX 5090D has modified specifications for the Chinese market, featuring lower AI performance (2,375 AI TOPS) compared to the international RTX 5090 (3,352 AI TOPS).
    3. Despite potential performance issues due to software compatibility, the RTX 5090D showed a +19.6% improvement over the RTX 4090 in overall benchmarks and a +102.7% increase in DirectX 12 tests.
    4. Comparisons are primarily made with the RTX 4090 instead of the RTX 4090D due to limited sample sizes for the latter, leading to less reliable performance data.
    5. Evidence suggests that the RTX 5090D sample may have been overclocked, achieving higher scores in additional benchmarks compared to the standard RTX 5090.


    Team Green has been under a lot of criticism lately for various reasons, but a recently tested Nvidia GeForce RTX 5090D (known as the “5090 D”) has shown impressive results on PassMark that should bring a smirk to Jensen Huang’s face. This graphics card, which is exclusively available in China, achieved an average score of 45,948 and reached 304 FPS in the site’s DirectX 12 test. For comparison, the next two best performers, the RTX 5090 and RTX 4090, scored 39,209 with 212 FPS and 38,430 with 150 FPS, respectively.

    Specifications Overview

    The GeForce RTX 5090D is Nvidia’s take on the standard RTX 5090, with minor modifications to allow it to be sold in China without attracting US backlash. The core specifications, such as the number of CUDA cores and memory setup, remain unchanged, but the RTX 5090D has a limited AI performance of 2,375 AI TOPS, while the international model boasts 3,352 AI TOPS (TOPS refers to trillions of operations per second). Even though the RTX 5090D is not as advanced in AI compared to the RTX 5090, it has still managed to perform exceptionally well in the G3D Mark benchmark.

    Performance Insights

    Additionally, it’s been pointed out that PassMark may have unintentionally reduced the performance of Blackwell cards due to compatibility issues with a software layer (specifically, Nvidia’s removal of 32-bit framework support). While the site works on a patch to address this, it’s likely that RTX 50-series cards will keep facing challenges. However, the regular RTX 5090 has successfully surpassed the RTX 4090 in the rankings, and the RTX 5090D has exceeded expectations as well. The Blackwell card registered a +19.6% improvement over the RTX 4090 in the overall benchmark and an incredible +102.7% increase over the Ada Lovelace card in the DirectX 12 test.

    Deliberate Comparisons

    The choice to compare with the RTX 4090, instead of the RTX 4090D, is intentional. Only nine samples of the China-only Ada Lovelace card have been evaluated on the site, compared to more than 14,500 for the standard RTX 4090, yielding significantly lower results: Overall – 28,686, DirectX 12 – 128 FPS. The GeForce RTX 5090D sample likely underwent overclocking, as there is evidence of this from a video shared by Tony Yu of Asus, showcasing a modified RTX 5090D card achieving 43,372 points in 3DMark Port Royal. In our analysis of the Nvidia GeForce RTX 5090 FE, the 3DMark Port Royal score was 37,335 points, indicating that the overclocked RTX 5090D has a +16.2% advantage.

    Source:
    Link


  • GeForce RTX 50-Series Benchmark Issues Resolved, New Gamer Problem Emerges

    GeForce RTX 50-Series Benchmark Issues Resolved, New Gamer Problem Emerges

    Key Takeaways

    1. Nvidia has removed 32-bit support for the GeForce RTX 50 series, impacting performance benchmarks.
    2. The RTX 5090 and RTX 5080 underperformed compared to older models like the RTX 4090 in PassMark tests.
    3. Compatibility issues with 32-bit CUDA and OpenCL appear to be the cause of performance drops in newer graphics cards.
    4. Some gamers are reverting to older graphics cards for better compatibility with games that require 32-bit support.
    5. The performance gap in benchmarks raises concerns about the overall gaming experience for users of the RTX 5090 and RTX 5080.


    Recently, we’ve been discussing the odd situation concerning new graphics cards like the GeForce RTX 5090 and RTX 5080 on the PassMark benchmark database. Even though both models did well in our extensive evaluations, they struggled to surpass their older counterparts on this specific platform. In fact, the RTX 5090 ended up ranking lower than the RTX 4090 regarding overall graphics benchmark performance. The surprising cause of these performance issues has now come to light via an X account associated with PassMark.

    Nvidia’s 32-Bit Support Removal

    In simple terms, Nvidia’s subtle withdrawal of 32-bit support for the GeForce RTX 50 series probably should have been more noticeable. While 32-bit CUDA (Nvidia’s unique framework) and 32-bit OpenCL (the open-source counterpart) will continue to function on older card generations, they are now “deprecated” for the Blackwell architecture. Although PassMark indicates that its PerformanceTest application is 64-bit, the compatibility issues likely led to the RTX 5090 and RTX 5080 either not functioning properly or underperforming. Ironically, the site mentions that they couldn’t even acquire an RTX 5090 for direct testing.

    Impacts on Benchmarking and Gaming Performance

    While this revelation does clarify why the RTX 5090 and RTX 5080 appeared less impressive compared to the RTX 4090 and RTX 4080 in this context, and a future update from PassMark may enhance the performance of the Blackwell cards, that’s unfortunately where the good news ends. As highlighted in the X post included below this article, the removal of software layer support doesn’t clarify why the RTX 5090 lags behind the RTX 4090 in the DirectX 9 test, especially when comparing sample sizes of 70 versus 14,521, which is quite unbalanced.

    Concerns for Gamers

    Moreover, while this development is positive for those who care mainly about benchmarks, it might spell trouble for gamers. Due to the support changes, many gamers have reported purchasing older graphics cards just to ensure compatibility with games that rely on 32-bit PhysX. For instance, a user named u/jerubedo is utilizing an RTX 3050 (Asus OC Edition, which is available on Amazon) alongside the RTX 5090 to mitigate possible software support challenges. Among various game tests, they discovered that running Batman Arkham Asylum at maximum settings without the RTX 3050 yielded 61 FPS, whereas using the older Ampere card increased performance to 390 FPS.

    Source:
    Link