Tag: PassMark

  • GeForce RTX 5090 Laptop Tops PassMark as Best Mobile GPU

    GeForce RTX 5090 Laptop Tops PassMark as Best Mobile GPU

    Key Takeaways

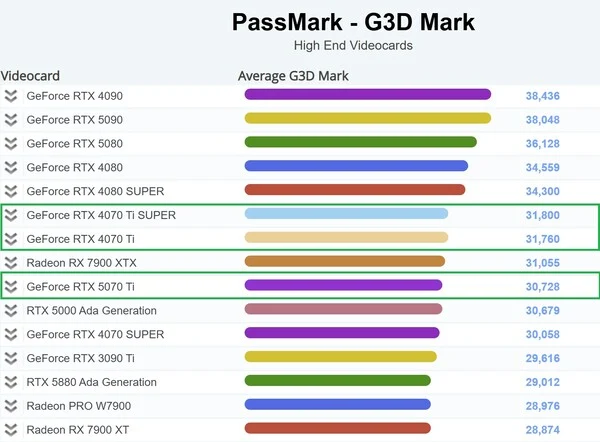
    1. The GeForce RTX 5090 Laptop GPU has achieved a score of 28,280 in PassMark’s G3D Mark, making it the highest-performing mobile GPU currently available, surpassing the RTX 4090 Laptop GPU by a small margin of +2.79%.

    2. The RTX 5090 Laptop GPU features enhanced specifications, including 24 GB of GDDR7 memory and 10,496 CUDA cores, compared to the 16 GB GDDR6 and 9,728 cores of the RTX 4090 Laptop GPU.

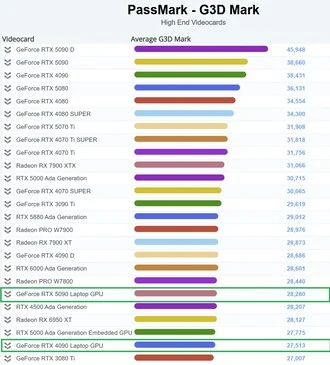
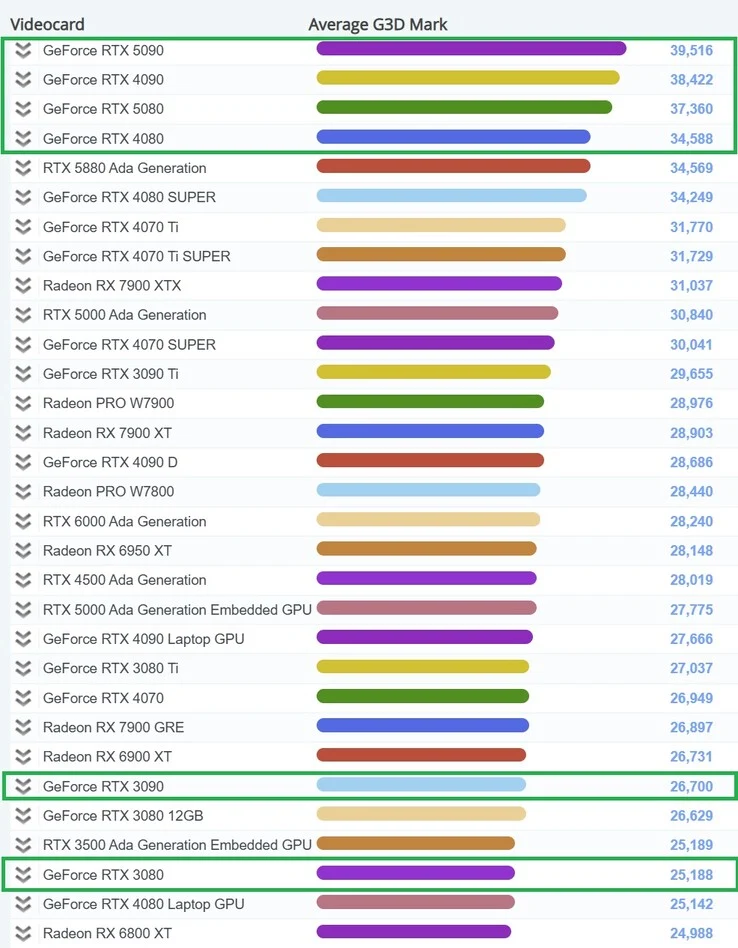
    3. The GPU has a thermal design power (TDP) ranging from 95-150 W, positioning it between the AMD Radeon RX 6950 XT and the Radeon PRO W7800 in performance rankings.

    4. Reactions to the RTX 5090’s performance are mixed; Nvidia supporters celebrate its top spot, while critics note its minimal advantage over the RTX 4090 and the age of the desktop cards it outperforms.

    5. Compatibility issues may affect the performance readings of the RTX 5090 Laptop GPU in benchmarks, as Nvidia has discontinued support for 32-bit frameworks, prompting PassMark to develop a patch for more accurate representation.


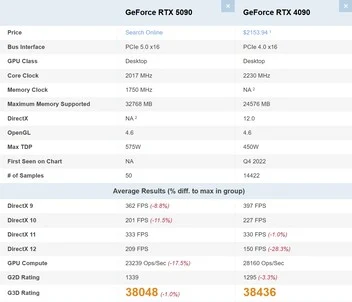
    A GeForce RTX 5090 Laptop GPU has surfaced in PassMark’s G3D Mark performance chart for top-tier video cards, currently boasting a score of 28,280 that places it above the RTX 4090 Laptop GPU. This indicates that the Blackwell chip has taken the title of the highest-performing mobile GPU on the platform, although only one sample has been logged as of now. The RTX 5090 Laptop GPU, with a thermal design power (TDP) ranging from 95-150 W, is positioned slightly above the AMD Radeon RX 6950 XT desktop graphics card (which came out in 2022) and just below the Radeon PRO W7800 desktop graphics card (released in 2023) in the latest rankings.

    Varied Reactions

    Depending on your preference for GPU brands, this might be seen as either an impressive outcome or a disappointing one. Those in favor of Nvidia will likely be thrilled that the GeForce RTX 5090 Laptop GPU has secured the top spot among mobile GPUs on the benchmark, achieving this with significantly lower TDPs compared to desktop models. However, critics may highlight the age of the desktop cards it surpasses and the minimal margin separating the RTX 5090 Laptop from the RTX 4090 Laptop (just +2.79%). In this instance, transitioning from an Ada Lovelace GPU to a Blackwell one appears to have its advantages.

    Enhanced Specifications

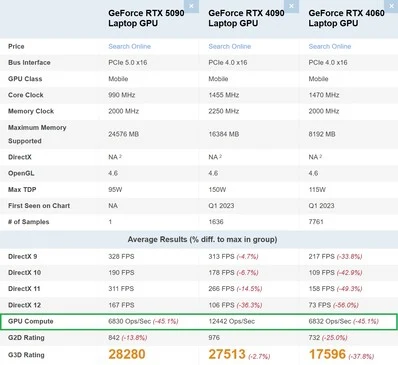
    To begin with, the RTX 5090 Laptop GPU is equipped with 24 GB of GDDR7 memory (while the 4090 Laptop has 16 GB GDDR6) and features 10,496 CUDA cores in contrast to its predecessor’s 9,728 cores. The new RTX 50-series mobile GPUs are expected to offer improved processing efficiency, aided by the latest Max-Q technologies which introduce many optimizations. Yet, amidst all these advancements, one might wonder why the RTX 5090 Laptop GPU is only +2.79% ahead of the RTX 4090 Laptop GPU (as found in the Alienware M18 R2, available on Amazon) in the primary performance chart and even seems to be on par with RTX 4060 Laptop GPU levels in PassMark’s GPU Compute evaluation.

    Potential Issues

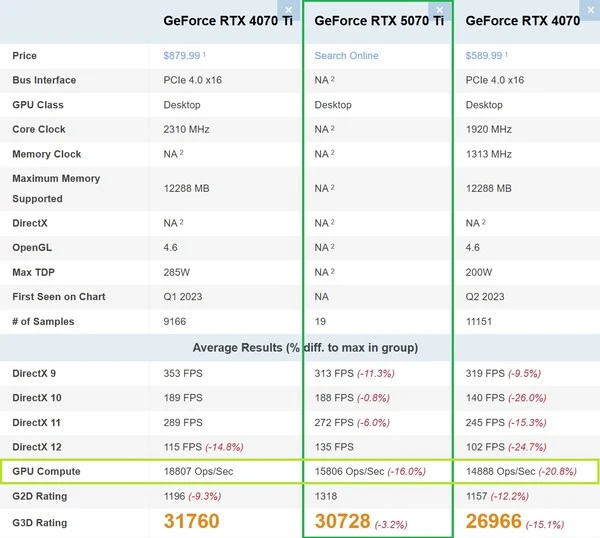
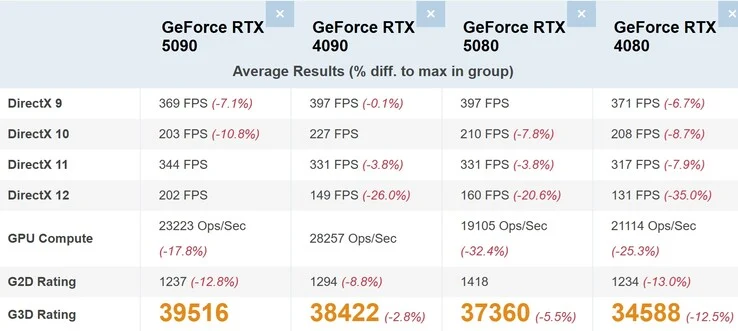
    This could likely stem from compatibility challenges. As previously mentioned, PassMark has revealed that the underwhelming performances of RTX 50-series cards in this specific benchmark may be attributed to Nvidia discontinuing support for 32-bit frameworks. The platform is currently working on a patch to ensure that Team Green’s products receive a more accurate representation in the benchmarks offered. As illustrated in the comparison below, the RTX 5090 Laptop GPU clearly outperforms the RTX 4060 Laptop GPU in DirectX 9-12 tests, yet it appears to perform comparably in GPU Compute. Regardless, this marks a promising beginning for Nvidia’s premier mobile chip, demonstrating its ability to achieve a high benchmark result even under less-than-ideal conditions.

    Source:
    Link


  • GeForce RTX 5090 Beats RTX 4090 in Graphics Card Benchmark

    GeForce RTX 5090 Beats RTX 4090 in Graphics Card Benchmark

    Key Takeaways

    1. The RTX 5090 has fallen to second place in PassMark’s G3D Mark benchmark, overtaken by the RTX 4090.
    2. The average score for the RTX 4090 increased, while the RTX 5090’s average score decreased due to more extensive testing samples.
    3. Possible reasons for the RTX 5090’s performance dip include driver issues, limited sample size, and missing Raster Output Pipelines (ROPs) in some models.
    4. The RTX 5090 outperforms the RTX 4090 in DirectX 12 tests, showing a +39.3% advantage in average frames per second.
    5. Despite having more CUDA cores, the RTX 5090 lags behind the RTX 4090 in GPU compute benchmarks by -17.5%.


    As gamers anxiously anticipate the performance of the new Nvidia GeForce RTX 5070, the flagship RTX 5090 appears to be facing some challenges. After recently achieving the top position on PassMark’s G3D Mark benchmark list, the RTX 5090 has now fallen to second place, overtaken by the RTX 4090. Initially, the Blackwell card had a slight lead of +2.85% over the Ada Lovelace model, but further testing of both cards has eliminated that small edge.

    Performance Shifts

    Since our last update, a significant number of RTX 4090 graphics cards have been evaluated, leading to an increase in its average score from 38,422 to 38,436 based on 14,422 tests. Meanwhile, the testing pool for the GeForce RTX 5090 has expanded from 13 to 50 samples, causing its average score to drop from 39,516 to 38,048, resulting in a decrease of -3.71%. This fluctuation indicates that there remains a possibility for the RTX 5090 to regain its leading position in this benchmark if more samples are tested in the future. The tests conducted cover DirectX versions 9 to 12, along with GPU compute evaluations.

    Possible Explanations

    There are several reasons that might explain this surprising turn of events. Driver problems have been reported, with some RTX 5090 units allegedly malfunctioning post-software updates. The sample size for the Blackwell card is still relatively limited, particularly when compared to the RTX 4090. Additionally, it has come to light that certain GeForce RTX 5090 models were lacking Raster Output Pipelines (ROPs), which are crucial hardware components for image rendering. The limited availability of units will also influence the number of graphics cards eligible for benchmarking.

    DirectX 12 Performance

    It’s important to note that the RTX 5090 does outperform the RTX 4090 in DirectX 12 tests, boasting a significant advantage of +39.3% in average frames per second (209 vs. 150). However, as previously mentioned, the GeForce RTX 5090 lags in the GPU compute benchmark by -17.5%, even though it has +32.8% more CUDA cores than the RTX 4090, which are necessary for executing parallel processing tasks. While it’s too soon to claim that Nvidia is not keeping up, these results may give gamers pause when considering such a pricey piece of hardware.

    Source:
    Link


  • RTX 5070 Ti vs RTX 4070 Ti: Early Benchmark Results Explained

    RTX 5070 Ti vs RTX 4070 Ti: Early Benchmark Results Explained

    Key Takeaways

    1. The new Blackwell GeForce RTX 50-series, particularly the RTX 5090, is showing inconsistent benchmark results, sometimes ranking just below the older RTX 4090.
    2. The RTX 5070 Ti has a respectable average score of 30,728 points but falls short of surpassing the RTX 4070 Ti and RTX 4070 Ti Super.
    3. Limited sample size of the RTX 5070 Ti (only 19 samples) may lead to fluctuating results, with expectations for improvement over time through driver updates.
    4. The RTX 5070 Ti’s GPU Compute score is significantly lower than the RTX 4070 Ti, trailing by nearly 16%, despite enhancements in the RTX 50-series.
    5. Overall, the RTX 5070 Ti shows competitive performance in various benchmarks, often exceeding its RTX 4070 predecessors.


    It’s not clear whether the inconsistency comes from the benchmark or the graphics cards themselves, but the new Blackwell GeForce RTX 50-series has shown varied results on PassMark lately. The RTX 5090 has been swinging between being the top-tier video card and the second place behind the RTX 4090. Now, we also have some data for the Nvidia GeForce RTX 5070 Ti, which is telling a somewhat similar story regarding its generational performance. The RTX 5070 Ti achieved a respectable average score of 30,728 points, but it was unable to surpass the older RTX 4070 Ti (2023 – Asus TUF Gaming variant on Amazon) and the RTX 4070 Ti Super (2024) models.

    Limited Samples Affect Results

    So far, only 19 samples of the GeForce RTX 5070 Ti have been recorded on the site, leading to the expectation that these results will improve over time, particularly with driver updates and fixes for any issues like the missing ROPs. The RTX 5070 Ti’s score is just -3.25% lower than the GeForce RTX 4070 Ti and -3.37% behind the GeForce RTX 4070 Ti Super. Both of these Ada Lovelace generation cards have been tested with thousands of samples, so RTX 5070 Ti owners shouldn’t feel too worried about these early results. Moreover, this new graphics card has shown competitive performance in other benchmarks, often exceeding its RTX 4070 predecessors.

    Comparing GPU Compute Scores

    However, what might cause some concern is a comparison involving the RTX 5090 and RTX 4090: The GPU Compute score for the RTX 5070 Ti is significantly lower than that of the RTX 4070 Ti. The comparative results are 15,806 operations per second versus 18,807 operations per second, indicating that the Blackwell card trails by nearly -16% (see screenshot below). Nvidia has incorporated numerous enhancements into the RTX 50-series cards, including GDDR7 memory and new generations of RT cores and Tensor cores, but it still feels odd to see the RTX 5070 Ti (15,806 Ops/sec) comparable to a standard RTX 4070 (14,888 Ops/sec) in benchmarks like GPU Compute.

    Source:
    Link


  • AMD and Intel Chips Show CPU Performance Stagnation in PassMark

    AMD and Intel Chips Show CPU Performance Stagnation in PassMark

    Key Takeaways

    1. Annual Performance Increase: PassMark’s data shows a consistent increase in CPU performance every year since 2004, with a modest 0.5% rise in laptop performance from 2019 to 2020.

    2. 2025 Performance Decline: Early 2025 data indicates a troubling slowdown in CPU performance, with a -0.5% decrease for desktops and -3.4% for laptops compared to 2024.

    3. Data Sampling Context: The performance decline in 2025 is based on a short time frame (first month and a half) compared to the full year of 2024, suggesting that results may change as the year progresses.

    4. Multiple Influencing Factors: The decline cannot be solely attributed to AMD and Intel, as factors like increased sales of lower-cost hardware, a shift to power-efficient machines, and potential software issues may also play a role.

    5. Changing Consumer Priorities: Consumers are increasingly valuing features such as mobility, battery life, and AI integration over raw CPU speed, impacting demand for high-performance CPUs.


    An interesting graph has been released by PassMark that tracks the annual changes in CPU performance, specifically the average CPU Mark, which is a benchmark test suite for processors on their platform. The graph illustrates that PassMark has been gathering data since 2004, and every year has shown an increase in the average performance of both laptop and desktop CPUs. While the performance increase for laptop processors from 2019 to 2020 was a modest 0.5%, it still indicates progress. However, for 2025, there appears to be a troubling slowdown in performance for both types of computers when looking at the average CPU Mark results.

    Data Comparison

    It’s important to note that PassMark is comparing just the first month and a half of 2025 to the entire year of 2024, so the downward trend might change as the year continues. A post from the benchmark site mentions that they haven’t seen this kind of effect in previous years, even with a possible rise in high-end computer sales during November and December. According to the data from PassMark, the average desktop CPU performance has decreased by -0.5% (47,810 samples versus 186,053 in 2024), while average laptop CPU performance dropped by -3.4% (25,541 samples compared to 101,316 in 2024).

    Factors Influencing Performance

    It would be naive to immediately blame AMD and Intel for the lack of generational performance improvements. There could be several reasons for the graph’s first decline in over two decades that may not directly relate to Team Red or Team Blue. PassMark suggests potential causes such as an increase in sales of lower-cost hardware, a push towards more power-efficient machines, issues with bloatware, and possible performance losses from operating systems. Notably, there have been no impressive spikes in performance from desktop chips like the Intel Core i9-7980XE (+71.9%), Ryzen Threadripper 3970X (+96.1%), and Ryzen Threadripper PRO 7995WX (+58.6%), nor from laptop models such as the Intel Core i9-12900HX (+42.8%) and AMD Ryzen 9 7945HX3D (+69.9%) in the early part of 2025.

    Changing Priorities in Computing

    Another clear reason could be linked to the fact that the RTX 50 series GPUs don’t seem to show the same performance improvements as their predecessors, and also why CPU families like Intel’s Arrow Lake and AMD’s Granite Ridge and Strix Point haven’t made a significant impact on average performance. One could argue that raw CPU power is not as vital to Team Blue and Team Red anymore, especially since GPUs and other components have become more advanced. Many consumers might not prioritize a faster CPU; instead, they seek features like mobility, extended battery life, AI integration, and overall efficiency over sheer speed. Furthermore, certain gamers may prefer to invest in the latest from Nvidia rather than upgrading their CPU, particularly if they already have a Zen 3 or Zen 4 Threadripper.

    Source:
    Link


  • Intel Core Ultra 9 275HX: Fastest Laptop Processor on PassMark

    Intel Core Ultra 9 275HX: Fastest Laptop Processor on PassMark

    An Intel Core Ultra 9 275HX processor has recently undergone testing on PassMark, showcasing exceptional performance across the entire CPU test suite. This new laptop chip has taken the lead in the CPU Mark rankings for mobile processors with an impressive score of 61,010, which is +6.83% higher than the AMD Ryzen 9 7945HX3D. The specific laptop used for testing this 24-core powerhouse has not been disclosed, but it is rumored to be associated with high-performance models such as the Asus ROG Strix Scar 16, Lenovo Legion Pro 7i Gen 10, and the MSI Vector 16 HX AI.

    Single Thread Performance Insights

    Despite its remarkable performance, the Core Ultra 9 275HX has not yet claimed the top spot for single thread performance, which is typically a strong suit for Intel. Competing Apple chips, such as the M3 Max 16 Core, M3 Max 14 Core, M3 Pro 11 Core, and M3 8 Core, have kept the Arrow Lake-HX chip from reaching the top of the rankings. These Apple processors appear to be specifically tuned for this type of benchmark test, even surpassing their M4 successors. Nevertheless, only one sample has been tested, suggesting that the Intel Core Ultra 9 275HX still has the potential to disrupt the current standings.

    Multi-Core Performance Comparison

    As many PC fans are aware, AMD places a strong emphasis on multi-core processing capabilities, so it’s no surprise that the Intel chip, which can reach 5.4 GHz, leads the single thread performance rankings against the Ryzen 9 7945HX3D. The Intel Core Ultra 9 275HX boasts a significant +16.4% advantage over AMD’s contender, and it maintains a +13.9% lead over the closest AMD competitor in this benchmark, the awkwardly named Ryzen AI 9 HX PRO 375. In terms of performance improvement, the Core Ultra 9 275HX shows a robust +33.7% increase over the Core i9-14900HX, which is found in laptops like the Lenovo Legion Pro 7i Gen 9, as indicated in the CPU Mark test suite.

    Conclusion

    Overall, the Intel Core Ultra 9 275HX stands out in its early testing, although it still faces stiff competition in certain areas. The ongoing developments in CPU technology promise exciting advancements for both Intel and AMD in the near future.

    Source:
    Link


  • RTX 5090 vs RTX 5080: Performance Gains vs GeForce 40 Series

    RTX 5090 vs RTX 5080: Performance Gains vs GeForce 40 Series

    It’s important to note from the beginning that the results presented come from only one benchmark and may not reflect the full performance capabilities of the GeForce RTX 5090 and RTX 5080. As anticipated, the Nvidia GeForce RTX 5090 has taken the lead in PassMark’s video card benchmark ranking (G3D Mark).

    Benchmarking Details

    The hardware underwent comprehensive testing, tracking FPS performance across DirectX 9, DirectX 10, DirectX 11, and DirectX 12, including a GPU Compute benchmark in the evaluation process. The RTX 5090 achieved a G3D score of 39,516, placing it at the top of the leaderboard, followed by the RTX 4090, RTX 5080, and RTX 4080. At first glance, this data seems promising.

    Performance Comparison

    However, a deeper look indicates that the performance improvements across generations aren’t as consistent when examining the G3D ratings:

    – RTX 4090 (38,422) – RTX 5090 (39,516): +2.85%
    – RTX 3090 (26,700) – RTX 4090 (38,422): +43.9%
    – RTX 4080 (34,588) – RTX 5080 (37,360): +8.01%
    – RTX 3080 (25,188) – RTX 4080 (34,588): +37.3%

    One could argue that this information is taken out of context, as it relies on a single benchmark, and that the Blackwell cards are equipped with new and enhanced technologies, like fourth-generation RT cores, fifth-generation Tensor cores, DLSS 4.0 Multi Frame Generation, and GDDR7 memory. Yet, this argument can also be made for the differences between the Ada Lovelace cards (GeForce 40 series) and the Ampere series (GeForce 30 series). For example, the former also came with next-gen RT cores and Tensor cores.

    Manufacturing Process Insights

    Crucially, the RTX 4080 and RTX 4090 utilize chips from TSMC’s 4N manufacturing process (within the 5 nm node family), while the RTX 3080 and RTX 3090 were made using an 8 nm process from Samsung (which was developed from 10 nm technology). The newly released RTX 5090 and RTX 5080 leverage GPUs based on an optimized variant of the 4N process, called 4NP, custom-designed for Nvidia by TSMC. It seems that a focus on refinement rather than sheer performance is the current trend.

    Source:
    Link


  • AMD Ryzen AI 7 350 Scores Well on PassMark for Single-Threaded Performance

    AMD Ryzen AI 7 350 Scores Well on PassMark for Single-Threaded Performance

    Yesterday, the Ryzen AI 7 350 from Krackan Point made quite an impact on Geekbench, showing a solid performance improvement compared to its Hawk Point variant. However, its performance on PassMark (thanks to @Olrak29_ on X for the info) isn’t as impressive, especially in multicore testing. This is somewhat expected since it has a combination of 4 Zen 5 cores and 4 Zen 5c cores.

    Performance Metrics

    The AMD Ryzen AI 7 350 achieved scores of 3,919 and 21,127 points in PassMark’s single-threaded and multithreaded tests, respectively. The single-thread score is similar to that of its Zen 5 sibling, the Ryzen AI 9 HX 370, which scored 3,977. This CPU has a thermal design power (TDP) of 45 Watts and includes a Radeon 860M integrated GPU.

    Comparing with Previous Generation

    In contrast, the previous generation, Ryzen 7 8845HS, had scores of 3,782 and 28,806 in the same benchmarks. This difference is anticipated, given that the Hawk Point version has eight full Zen 4 cores, which results in superior multithread performance. The single-thread performance of the Ryzen AI 7 350 is where it shines, but it loses ground on the multicore front.

    Rivalry with Other Processors

    Intel’s Lunar Lake-based Core Ultra 7 258V slightly outperforms in single-thread tests with a score of 4,109. Its multithread performance is surprisingly close at 20,018, even without hyperthreading. The unexpected competitor here is Qualcomm’s Snapdragon X Elite X1E-80-100, which manages to surpass in multithreaded performance with a score of 23,400. However, in single-thread performance, the Krackan Point CPU takes the lead, as the Qualcomm processor scores 3,318.

    Naturally, these benchmarks don’t fully capture the true performance of the Ryzen AI 7 350. We’ll have a clearer picture when it officially launches at CES 2025, alongside Strix Halo and a potential refresh of Hawk Point.

    Source: Link