
Key Takeaways
1. The iPhone 17 Pro features a new vapour chamber cooling system, enhancing thermal management for better performance.
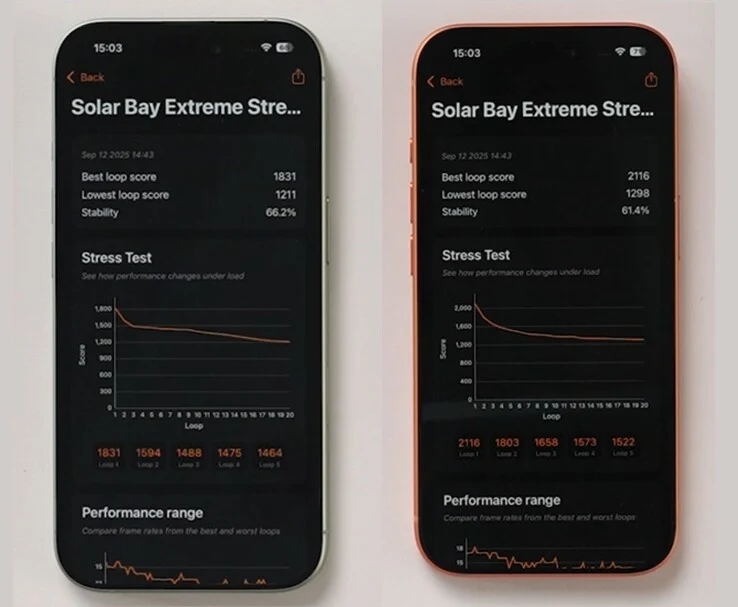
2. In a stress test, the iPhone 17 Pro scored a stability rating of 61.4%, while the iPhone 17 with the standard A19 chip scored 66.2%.
3. The iPhone 17 Pro outperformed the iPhone 17 in Best loop scores (2,116 vs. 1,831), but the iPhone 17 Pro Max achieved the highest scores overall.
4. The stability of the iPhone 16 Pro Max and iPhone 17 Pro Max was nearly identical, indicating effective performance balancing by Apple.
5. The iPhone 17 Air, with its less powerful A19 chip, performed worse than the base iPhone 17 model in benchmark tests.
The iPhone 17 Pro has been introduced with various updates in terms of design, camera, and battery. One of the most significant enhancements is the new vapour chamber cooling system. This upgraded cooling technology is logical, especially since the A19 Pro chip is said to perform well, especially in graphics processing.
Performance Review
When popular YouTuber The Tech Chap reviewed the Apple iPhone 17 Air, it gave us a chance to see how the iPhone 17 Pro compares to other models from this year and the previous iPhone 16 Pro Max. During the 3DMark Solar Bay Extreme stress test, which lasts around 20 minutes and tests ray tracing performance over time, the iPhone 17 Pro with the advanced A19 Pro chip scored a stability rating of 61.4%. In contrast, the more budget-friendly iPhone 17 with the standard A19 chip achieved a stability score of 66.2%, which is clearly better.
Score Comparisons
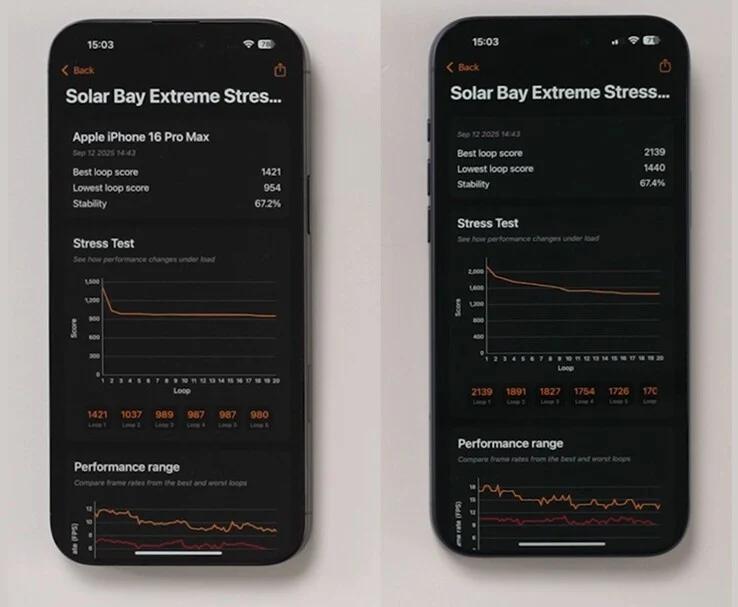
The iPhone 17 and iPhone 17 Pro had similar Lowest loop scores, with figures of 1,211 and 1,298, respectively. However, when assessing the Best loop scores, there was a notable difference: the iPhone 17 scored 1,831 while the iPhone 17 Pro reached 2,116. This indicates that, although the A19 Pro chip is quite potent, users seeking top performance should consider the iPhone 17 Pro Max. This model recorded the highest Best and Lowest loop scores of 2,139 and 1,440, respectively, with an overall stability of 67.4%.
Insights on Stability
A fascinating finding from the benchmark tests is that the iPhone 16 Pro Max and the iPhone 17 Pro Max displayed nearly the same stability throughout the stress test. This implies that Apple has effectively balanced increased performance with better thermal management, as the differences are quite notable. The Best loop score for the iPhone 16 Pro Max at 1,421 is actually a tad lower than the Lowest loop score of the iPhone 17 Pro Max.
If you’re curious about the performance of the iPhone 17 Air, the video primarily highlights it, and you can check it out through the link below. Analyzing the benchmark data from this test suggests that the slightly less powerful A19 Pro chip, which has one fewer GPU core in the iPhone 17 Air, performs even worse than the base model iPhone 17.
Source:
Link
Leave a Reply