Tag: PassMark

  • Intel Core Ultra 9 275HX: Fastest Laptop Processor on PassMark

    Intel Core Ultra 9 275HX: Fastest Laptop Processor on PassMark

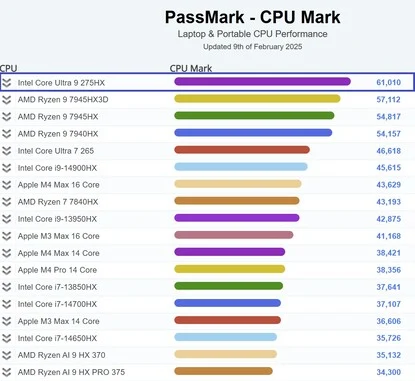
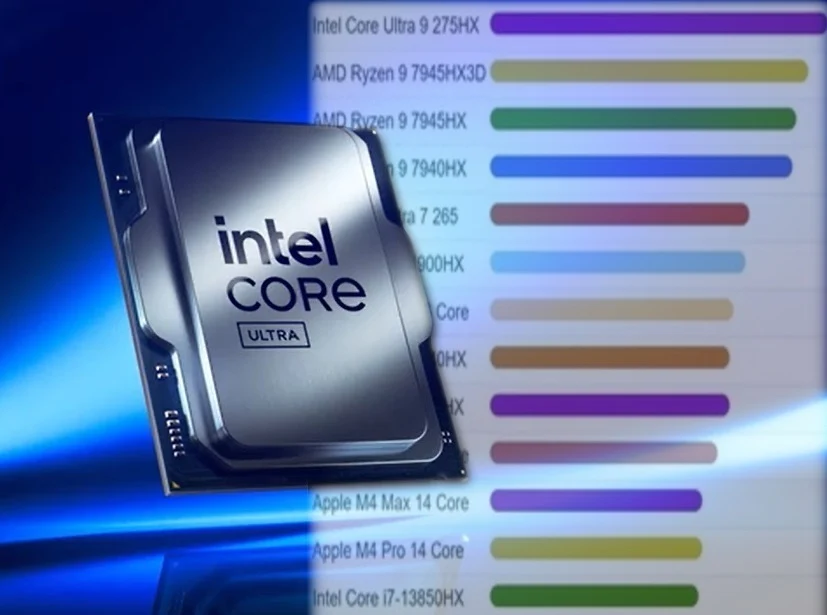
    An Intel Core Ultra 9 275HX processor has recently undergone testing on PassMark, showcasing exceptional performance across the entire CPU test suite. This new laptop chip has taken the lead in the CPU Mark rankings for mobile processors with an impressive score of 61,010, which is +6.83% higher than the AMD Ryzen 9 7945HX3D. The specific laptop used for testing this 24-core powerhouse has not been disclosed, but it is rumored to be associated with high-performance models such as the Asus ROG Strix Scar 16, Lenovo Legion Pro 7i Gen 10, and the MSI Vector 16 HX AI.

    Single Thread Performance Insights

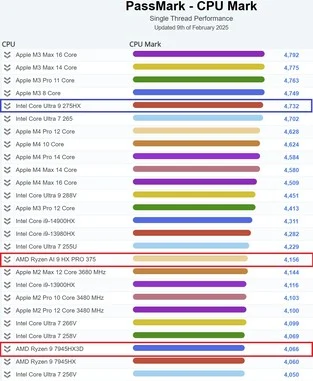
    Despite its remarkable performance, the Core Ultra 9 275HX has not yet claimed the top spot for single thread performance, which is typically a strong suit for Intel. Competing Apple chips, such as the M3 Max 16 Core, M3 Max 14 Core, M3 Pro 11 Core, and M3 8 Core, have kept the Arrow Lake-HX chip from reaching the top of the rankings. These Apple processors appear to be specifically tuned for this type of benchmark test, even surpassing their M4 successors. Nevertheless, only one sample has been tested, suggesting that the Intel Core Ultra 9 275HX still has the potential to disrupt the current standings.

    Multi-Core Performance Comparison

    As many PC fans are aware, AMD places a strong emphasis on multi-core processing capabilities, so it’s no surprise that the Intel chip, which can reach 5.4 GHz, leads the single thread performance rankings against the Ryzen 9 7945HX3D. The Intel Core Ultra 9 275HX boasts a significant +16.4% advantage over AMD’s contender, and it maintains a +13.9% lead over the closest AMD competitor in this benchmark, the awkwardly named Ryzen AI 9 HX PRO 375. In terms of performance improvement, the Core Ultra 9 275HX shows a robust +33.7% increase over the Core i9-14900HX, which is found in laptops like the Lenovo Legion Pro 7i Gen 9, as indicated in the CPU Mark test suite.

    Conclusion

    Overall, the Intel Core Ultra 9 275HX stands out in its early testing, although it still faces stiff competition in certain areas. The ongoing developments in CPU technology promise exciting advancements for both Intel and AMD in the near future.

    Source:
    Link


  • RTX 5090 vs RTX 5080: Performance Gains vs GeForce 40 Series

    RTX 5090 vs RTX 5080: Performance Gains vs GeForce 40 Series

    It’s important to note from the beginning that the results presented come from only one benchmark and may not reflect the full performance capabilities of the GeForce RTX 5090 and RTX 5080. As anticipated, the Nvidia GeForce RTX 5090 has taken the lead in PassMark’s video card benchmark ranking (G3D Mark).

    Benchmarking Details

    The hardware underwent comprehensive testing, tracking FPS performance across DirectX 9, DirectX 10, DirectX 11, and DirectX 12, including a GPU Compute benchmark in the evaluation process. The RTX 5090 achieved a G3D score of 39,516, placing it at the top of the leaderboard, followed by the RTX 4090, RTX 5080, and RTX 4080. At first glance, this data seems promising.

    Performance Comparison

    However, a deeper look indicates that the performance improvements across generations aren’t as consistent when examining the G3D ratings:

    – RTX 4090 (38,422) – RTX 5090 (39,516): +2.85%
    – RTX 3090 (26,700) – RTX 4090 (38,422): +43.9%
    – RTX 4080 (34,588) – RTX 5080 (37,360): +8.01%
    – RTX 3080 (25,188) – RTX 4080 (34,588): +37.3%

    One could argue that this information is taken out of context, as it relies on a single benchmark, and that the Blackwell cards are equipped with new and enhanced technologies, like fourth-generation RT cores, fifth-generation Tensor cores, DLSS 4.0 Multi Frame Generation, and GDDR7 memory. Yet, this argument can also be made for the differences between the Ada Lovelace cards (GeForce 40 series) and the Ampere series (GeForce 30 series). For example, the former also came with next-gen RT cores and Tensor cores.

    Manufacturing Process Insights

    Crucially, the RTX 4080 and RTX 4090 utilize chips from TSMC’s 4N manufacturing process (within the 5 nm node family), while the RTX 3080 and RTX 3090 were made using an 8 nm process from Samsung (which was developed from 10 nm technology). The newly released RTX 5090 and RTX 5080 leverage GPUs based on an optimized variant of the 4N process, called 4NP, custom-designed for Nvidia by TSMC. It seems that a focus on refinement rather than sheer performance is the current trend.

    Source:
    Link


  • AMD Ryzen AI 7 350 Scores Well on PassMark for Single-Threaded Performance

    AMD Ryzen AI 7 350 Scores Well on PassMark for Single-Threaded Performance

    Yesterday, the Ryzen AI 7 350 from Krackan Point made quite an impact on Geekbench, showing a solid performance improvement compared to its Hawk Point variant. However, its performance on PassMark (thanks to @Olrak29_ on X for the info) isn’t as impressive, especially in multicore testing. This is somewhat expected since it has a combination of 4 Zen 5 cores and 4 Zen 5c cores.

    Performance Metrics

    The AMD Ryzen AI 7 350 achieved scores of 3,919 and 21,127 points in PassMark’s single-threaded and multithreaded tests, respectively. The single-thread score is similar to that of its Zen 5 sibling, the Ryzen AI 9 HX 370, which scored 3,977. This CPU has a thermal design power (TDP) of 45 Watts and includes a Radeon 860M integrated GPU.

    Comparing with Previous Generation

    In contrast, the previous generation, Ryzen 7 8845HS, had scores of 3,782 and 28,806 in the same benchmarks. This difference is anticipated, given that the Hawk Point version has eight full Zen 4 cores, which results in superior multithread performance. The single-thread performance of the Ryzen AI 7 350 is where it shines, but it loses ground on the multicore front.

    Rivalry with Other Processors

    Intel’s Lunar Lake-based Core Ultra 7 258V slightly outperforms in single-thread tests with a score of 4,109. Its multithread performance is surprisingly close at 20,018, even without hyperthreading. The unexpected competitor here is Qualcomm’s Snapdragon X Elite X1E-80-100, which manages to surpass in multithreaded performance with a score of 23,400. However, in single-thread performance, the Krackan Point CPU takes the lead, as the Qualcomm processor scores 3,318.

    Naturally, these benchmarks don’t fully capture the true performance of the Ryzen AI 7 350. We’ll have a clearer picture when it officially launches at CES 2025, alongside Strix Halo and a potential refresh of Hawk Point.

    Source: Link